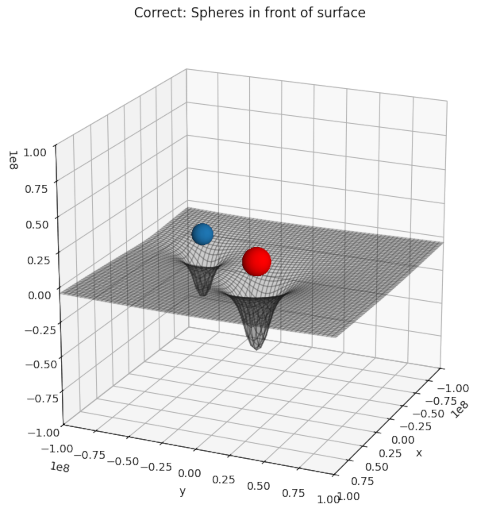
Recently, I needed a certain type of 3D-illustration for a post series about cosmology. I wanted to show a 2-dimensional manifold above a mesh grid with respective coordinate lines on the surface. In front of the surface I wanted to place some opaque spheres. Such illustrations are often used in physics to demonstrate the effect of some objects on a physical quantity – e.g. of spherical bodies on the gravitational potential or on a component of the metric tensor of space-time.
The simple problem to get a correct rendering of objects along a defined line of view upon a 3D scene posed a problem for Matplotlib’s 3D renderer for multiple objects in a 3D axis frame (created by ax = plt.axes(projection=’3d’)). The occlusion of objects was displayed wrongly for most view ports and viewing angles.
In this post, I briefly want to outline how this problem can be solved with the help of S3Dlib. As a beginner regarding the use of S3Dlib, I had to overcome some problems there, too. So, this small exercise with some options of S3Dlib might be interesting for some readers which want to use Python and Matplotlib for rendering simple 3D scenes.
The following plot shows what I wanted to achieve: