When you start working with Google’s Tensorflow on multi-layer and “deep learning” artificial neural networks the performance of the required mathematical operations may sooner or later become important. One approach to better performance is the use of a GPU (or multiple GPUs) instead of a CPU. Personally, I am not yet in a situation where GPU support is really required. My experimental CNNs are too small, yet. But starting with Keras and Tensorflow is a good point to cover the use of a GPU on my Opensuse Leap 15 systems anyway. Actually, it is also helpful for some tasks in security related environments, too. One example is testing the quality of passphrases for encryption. With JtR you may gain a factor of 10 in performance. It is interesting, how much faster an old 960 GTX card will be for a simple Tensorflow test application than my i7 CPU.
I have used Nvidia GPUs almost all my Linux life. To get GPU support for Nvidia graphics cards you need to install CUDA in its present version. This is 10.1 in August 2019. You get download and install information for CUDA at
https://developer.nvidia.com/cuda-zone => https://developer.nvidia.com/cuda-downloads
For an RPM for the x86-64 architecture and Opensuse Leap see:
https://developer.nvidia.com/cuda-downloads?….
Installation of “CUDA” and “cudcnn”
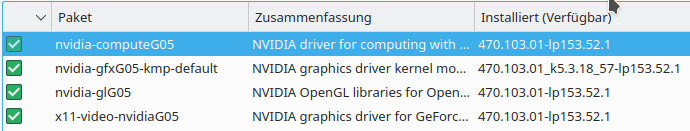
You may install the downloaded RPM (in my “case cuda-repo-opensuse15-10-1-local-10.1.168-418.67-1.0-1.x86_64.rpm”) via YaST. After this first step you in a second step install the meta-packet named “cuda”, which is available in YaST at this point. Or just install all other packets with “cuda” in the name (with the exception of the source code and dev-packets) via YaST.
A directory “/usr/local/cuda” will be built; its entries are soft links to files in a directory “/usr/local/cuda-10.1“.
Note the “include” and the “lib64” sub-directories! After the installation, also links should exist in the central “/usr/lib64“-directory pointing to the files in “/usr/local/cuda/lib64“.
Note from the file-endings that the particular present version [Aug. 2019) of the files may be something like “10.1.168“.
Another important point is that you need to install “cudnn” (cudnn-10.1-linux-x64-v7.6.2.24.tgz) – a Nvidia specific library for certain Deep Learning program elements, which shall be executed on Nvidia GPU chips. You get these files via “https://developer.nvidi.com/cudnn“. Unfortunately, you must become member of the Nvidia developer community to get access to these special files. After you downloaded the tgz-file and expanded it, you find some directories “include” and “lib64” with relevant files. You just copy these files (as user root) into the directories “/usr/local/cuda/include” and “/usr/local/cuda/lib64”, respectively. Check the owner/group and rights of the copied files afterwards and change them to root/root and standard rights – just as given for the other files in teh target directories.
The final step is the follwoing:
Create links by dragging the contents of “/usr/local/cuda/include” to “/usr/include” and chose the option “Link here”. Do the same for the files of “/usr/local/cuda/lib64” with “/usr/lib64” as the target directory. If you look at the link-directories of the files now in “usr/include” and “usr/lib64” you see exactly which files were given by the CUDA and cudcnn installation.
nAdditional libraries
In case you want to use Keras it is recommended to install the “openblas” libraries including the development packages on the Linux OS level. On an Opensuse system just search for packages with “openblas” and install them all. The same is true for the h5py-libraries. In your virtual python environment execute:
< p style="margin-left:50px;"pip3 install --upgrade h5py
Problems with errors regarding missing CUDA libraries after installation
Two stupid things may happen after this straight-forward installation :
- The link structure between “/usr/lib64” and the files in “/usr/local/cuda/include” and “/usr/local/cuda/lib64” may be incomplete.
- Although there are links from files as “libcufftw.so.10” to something like “libcufftw.so.10.1.168” some libraries and TensorFlow components may expect additional links as “libcufftw.so.10.0” to “libcufftw.so.10.1.168”
Both points lead to error messages when I tried to use GPU related test statements on a PyDEV console or Jupyter cell. Watch out for error messages which tell you about errors when opening specific libraries! In the case of Jupyter you may find such messages on the console or terminal window from which you started your test.
A quick remedy is to use a file-manager as “dolphin” as user root, mark all files in “/usr/local/cuda/include” and “usr/local/cuda/lib64” and place them as (soft) links into “/usr/include” and “/usr/lib64”, respectively. Then create additional links there for the required libraries “libXXX.so.10.0” to “libXXX.so.10.1.168“, where “XXX” stands for some variable part of the file name.
A simple test with Keras and the mnist dataset
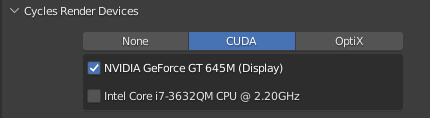
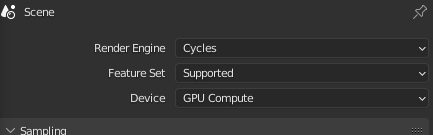
I assume that you have installed the packages for tensorflow, tensorflow-gpu (!) and keras with pip3 in your Python virtualenv. Note that the package “tensorflow-gpu” MUST be installed after “tensorflow” to make the use of the GPU possible.
Then a test with a simple CNN for the “mnist” datatset can deliver information on performance differences :
Cell 1 of a Jupyter notebook:
import time
import tensorflow as tf
from keras import backend as K
from tensorflow.python.client import device_lib
from keras.datasets import mnist
from keras import models
from keras import layers
from keras.utils import to_categorical

# function to provide CPU/GPU information
# ---------------------------------------
def get_CPU_GPU_details():
    print("GPU ? ", tf.test.is_gpu_available())
    tf.test.gpu_device_name()
    print(device_lib.list_local_devices())

# information on available CPUs/GPUs
# --------------------------------------
if tf.test.is_gpu_available(
    cuda_only=False,
    min_cuda_compute_capability=None):
    print ("GPU is available")
get_CPU_GPU_details()

# Setting a parameter GPU or CPU usage
#--------------------------------------
#gpu = False
gpu = True
if gpu:
    GPU = True;  CPU = False; num_GPU = 1; num_CPU = 1
else:
    GPU = False; CPU = True;  num_CPU = 1; num_GPU = 0
num_cores = 6

# control of GPU or CPU usage in the TF environment
# -------------------------------------------------
# See the literature links at the article's end for more information

config = tf.ConfigProto(intra_op_parallelism_threads=num_cores,
                        inter_op_parallelism_threads=num_cores,
                        allow_soft_placement=True,
                        device_count = {'CPU' : num_CPU,
                                        'GPU' : num_GPU},
                        log_device_placement=True

                       )
config.gpu_options.per_process_gpu_memory_
fraction=0.4
config.gpu_options.force_gpu_compatible = True
session = tf.Session(config=config)
K.set_session(session)

#--------------------------
# Loading the mnist datatset via Keras
#--------------------------
(train_images, train_labels), (test_images, test_labels) = mnist.load_data()
network = models.Sequential()
network.add(layers.Dense(512, activation='relu', input_shape=(28*28,)))
network.add(layers.Dense(10, activation='softmax'))
network.compile(optimizer='rmsprop', loss='categorical_crossentropy', metrics=['accuracy'])
train_images = train_images.reshape((60000, 28*28))
train_images = train_images.astype('float32') / 255
test_images = test_images.reshape((10000, 28*28))
test_images = test_images.astype('float32') / 255
train_labels = to_categorical(train_labels)
test_labels = to_categorical(test_labels)
Output of the code in cell 1:
GPU is available
GPU ?  True
[name: "/device:CPU:0"
device_type: "CPU"
memory_limit: 268435456
locality {
}
incarnation: 17801622756881051727
, name: "/device:XLA_GPU:0"
device_type: "XLA_GPU"
memory_limit: 17179869184
locality {
}
incarnation: 6360207884770493054
physical_device_desc: "device: XLA_GPU device"
, name: "/device:XLA_CPU:0"
device_type: "XLA_CPU"
memory_limit: 17179869184
locality {
}
incarnation: 7849438889532114617
physical_device_desc: "device: XLA_CPU device"
, name: "/device:GPU:0"
device_type: "GPU"
memory_limit: 2115403776
locality {
  bus_id: 1
  links {
  }
}
incarnation: 4388589797576737689
physical_device_desc: "device: 0, name: GeForce GTX 960, pci bus id: 0000:01:00.0, compute capability: 5.2"
]
Note the control settings for GPU usage via the parameter gpu and the variable “config”. If you do NOT want to use the GPU execute
config = tf.ConfigProto(device_count = {‘GPU’: 0, ‘CPU’ : 1})
Information on other control parameters which can be used together with “tf.ConfigProto” is provided here:
https://stackoverflow.com/questions/40690598/can-keras-with-tensorflow-backend-be-forced-to-use-cpu-or-gpu-at-will
Cell 2 of a Jupyter notebook for performance measurement during training:
start_c = time.perf_counter()
with tf.device("/GPU:0"):
    network.fit(train_images, train_labels, epochs=5, batch_size=30000)
end_c = time.perf_counter()
if CPU:
    print('Time_CPU: ', end_c - start_c)
else:
    print('Time_GPU: ', end_c - start_c)
Output of the code in cell 2 :
Epoch 1/5
60000/60000 [==============================] - 0s 3us/step - loss: 0.5817 - acc: 0.8450
Epoch 2/5
60000/60000 [==============================] - 0s 3us/step - loss: 0.5213 - acc: 0.8646
Epoch 3/5
60000/60000 [==============================] - 0s 3us/step - loss: 0.4676 - acc: 0.8832
Epoch 4/5
60000/60000 [==============================] - 0s 3us/step - loss: 0.4467 - acc: 0.8837
Epoch 5/5
60000/60000 [==============================] - 0s 3us/step - loss: 0.4488 - acc: 0.8726
Time_GPU:  0.7899935730001744
Now change the following lines in cell 1
...
gpu = False
#gpu = True
...
Executing the code in cell 1 and cell 2 then gives:
Epoch 1/5
60000/60000 [==============================] - 0s 6us/step - loss: 0.4323 - acc: 0.8802
Epoch 2/5
60000/60000 [==============================] - 0s 7us/step - loss: 0.3932 - acc: 0.8972
Epoch 3/5
60000/60000 [==============================] - 0s 6us/step - loss: 0.3794 - acc: 0.8996
Epoch 4/5
60000/60000 [==============================] - 0s 6us/step - loss: 0.3837 - acc: 0.8941
nEpoch 5/5
60000/60000 [==============================] - 0s 6us/step - loss: 0.3830 - acc: 0.8908
Time_CPU:  1.9326397939985327
Thus the GPU is faster by a factor of 2.375 !
At least for the chosen batch size of 30000! You should play a bit around with the batch size to understand its impact.
2.375 is not a big factor – but I have a relatively old GPU (GTX 960) and a relatively fast CPU i7-6700K mit 4GHz Taktung: So I take what I get 🙂 . A GTX 1080Ti would give you an additional factor of around 4.
Watching GPU usage during Python code execution
A CLI command which gives you updated information on GPU usage and memory consumption on the GPU is
nvidia-smi -lms 250
It gives you something like
Mon Aug 19 22:13:18 2019
+-----------------------------------------------------------------------------+
| NVIDIA-SMI 418.67       Driver Version: 418.67       CUDA Version: 10.1     |
|-------------------------------+----------------------+----------------------+
| GPU  Name        Persistence-M| Bus-Id        Disp.A | Volatile Uncorr. ECC |
| Fan  Temp  Perf  Pwr:Usage/Cap|         Memory-Usage | GPU-Util  Compute M. |
|===============================+======================+======================|
|   0  GeForce GTX 960     On   | 00000000:01:00.0  On |                  N/A |
| 20%   44C    P0    33W / 160W |   3163MiB /  4034MiB |      1%      Default |
+-------------------------------+----------------------+----------------------+

+-----------------------------------------------------------------------------+
| Processes:                                                       GPU Memory |
|  GPU       PID   Type   Process name                             Usage      |
|=============================================================================|
|    0      4124      G   /usr/bin/X                                   610MiB |
|    0      4939      G   kwin_x11                                      54MiB |
|    0      4957      G   /usr/bin/krunner                               1MiB |
|    0      4959      G   /usr/bin/plasmashell                         195MiB |
|    0      5326      G   /usr/bin/akonadi_archivemail_agent             2MiB |
|    0      5332      G   /usr/bin/akonadi_imap_resource                 2MiB |
|    0      5338      G   /usr/bin/akonadi_imap_resource                 2MiB |
|    0      5359      G   /usr/bin/akonadi_mailfilter_agent              2MiB |
|    0      5363      G   /usr/bin/akonadi_sendlater_agent               2MiB |
|    0      5952      C   /usr/lib64/libreoffice/program/soffice.bin    38MiB |
|    0      8240      G   /usr/lib64/firefox/firefox                     1MiB |
|    0     13012      C   /projekte/GIT/ai/ml1/bin/python3            2176MiB |
|    0     14233      G   ...uest-channel-token=14555524607822397280    62MiB |
+-----------------------------------------------------------------------------+
During code execution some of the displayed numbers – e.g for GPU-Util, GPU memory Usage – will start to vary.
Links
https://medium.com/@liyin2015/tensorflow-cpus-and-gpus-configuration-9c223436d4ef
https://www.tensorflow.org/beta/guide/using_gpu
https://stackoverflow.com/questions/40690598/can-keras-with-tensorflow-backend-be-forced-to-use-cpu-or-gpu-at-will
https://stackoverflow.com/questions/42706761/closing-session-in-tensorflow-
doesnt-reset-graph
http://www.science.smith.edu/dftwiki/index.php/Setting up Tensorflow 1.X on Ubuntu 16.04 w/ GPU support
https://hackerfall.com/story/which-gpus-to-get-for-deep-learning
https://towardsdatascience.com/measuring-actual-gpu-usage-for-deep-learning-training-e2bf3654bcfd